Multiple Timeframe Trading: zoom in and zoom out.
Multiple Timeframe Trading means learning to see the correlation between multiple timeframes.
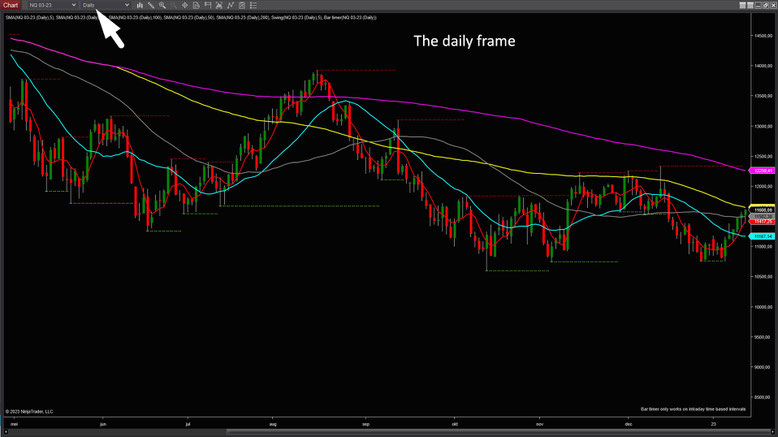
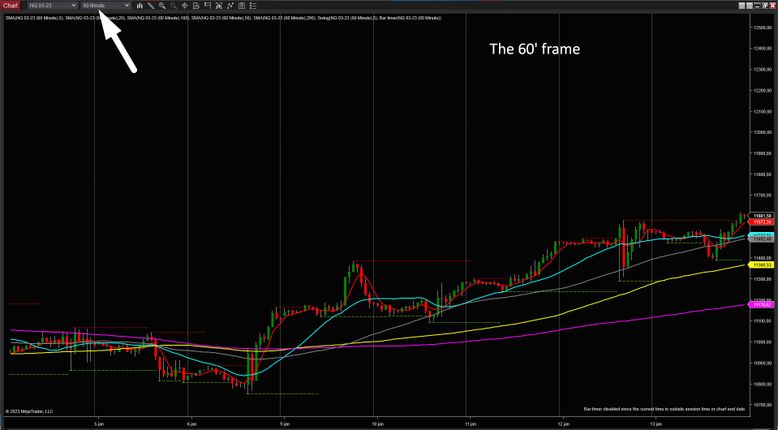
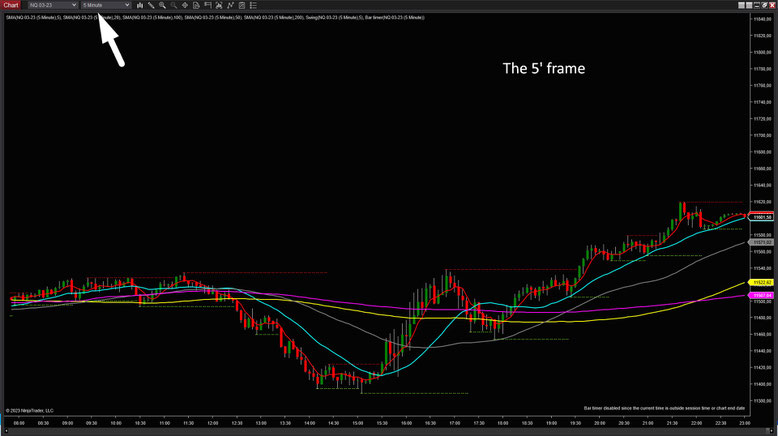
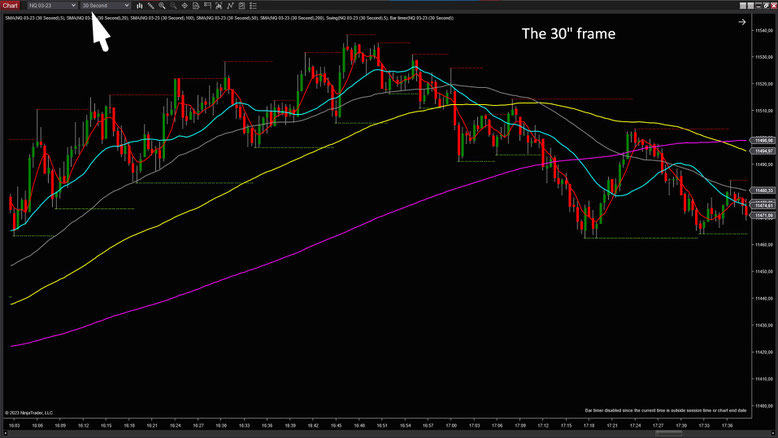
I have been studying the 5' chart in conjunction with the 60' chart in conjunction with the
daily chart in conjunction with the monthly chart.
This choice is mathematically logical because a candle of a larger timeframe is always formed by X number of candles of the lower timeframe.
We also know that the trend of the bigger picture MUST be respected.
These important insights often give us great opportunities to trade in anticipation, using moving averages, support and resistance lines and supply and demand zones.
In other words, anyone who wants to earn in the stock market will have to do a lot of homework to succeed.
No pain, no gain.
Did you know that...
Every timeframe, no matter how small or large, always has the same look and feel?
That our technical analysis tools are applicable in all time frames?
Some examples